Have you ever been solving a math problem or looking at a list of numbers in class and suddenly come across the term range? Many students pause and wonder,
“What does range mean in math?” 🤔 At first, it may sound like a complicated statistics term, but it’s actually one of the easiest concepts in mathematics to understand. Once you learn how it works, calculating the range of a data set becomes quick and simple.
Quick Answer:
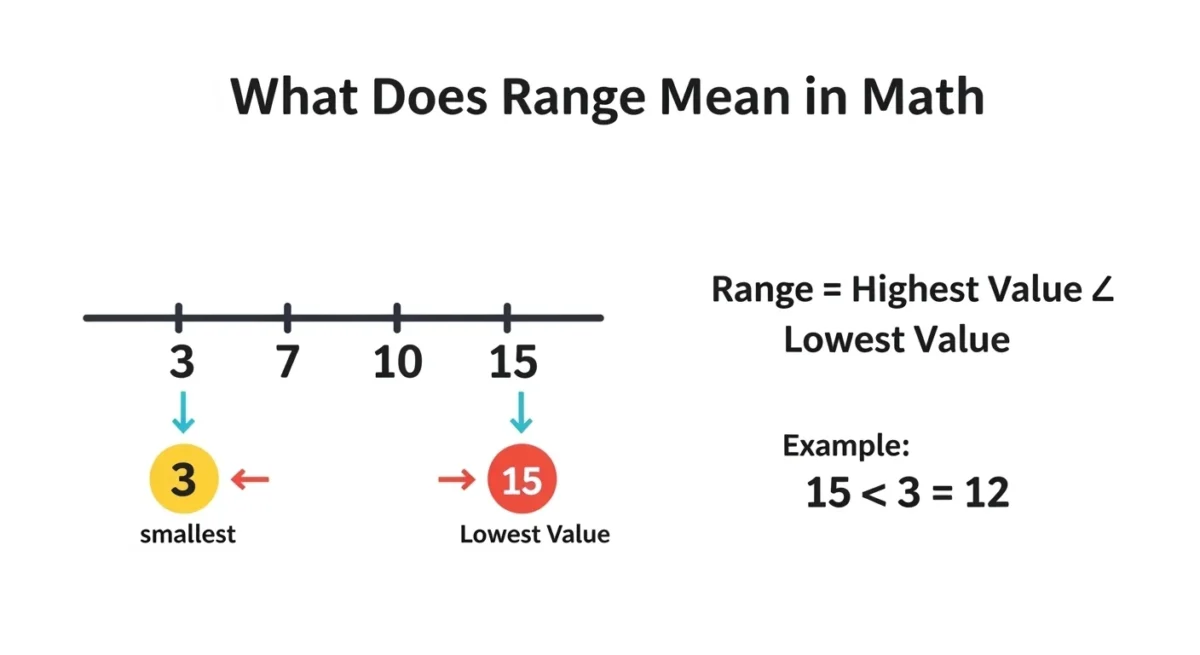
The range in math is the difference between the highest value and the lowest value in a set of numbers. It helps measure how spread out the numbers are in a data set.
What Does Range Mean in Math?
The range definition in math is simple: it describes the distance between the largest and smallest numbers in a data set. This concept is commonly used in statistics and mathematics to understand how widely numbers vary.
When you look at a group of numbers, the range tells you how far apart the highest and lowest values are. Because of this, range is considered one of the basic measures of dispersion in statistics.
Quick Definition
Range in math is the difference between the highest value and the lowest value in a data set.
This means if you know the largest number and the smallest number, you can easily calculate the range.
In short:
Range = Highest value − Lowest value = Spread of numbers
Range Formula in Math
The range formula in math is very straightforward.
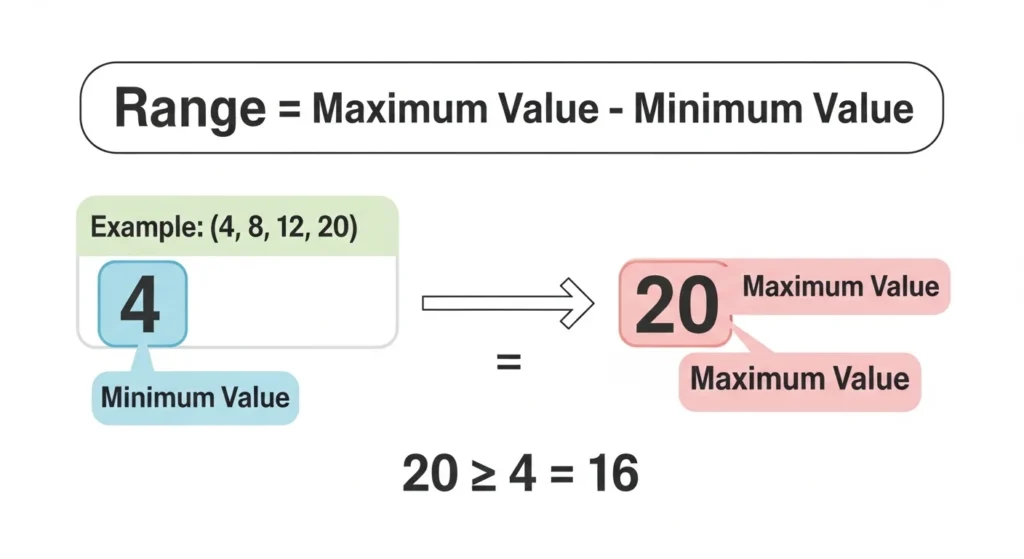
Range = Maximum Value − Minimum Value
Where:
- Maximum value = the largest number in the data set
- Minimum value = the smallest number in the data set
This formula is used in both basic mathematics and statistics when analyzing numbers.
Example
Data set: 5, 8, 12, 20
Highest value = 20
Lowest value = 5
Range = 20 − 5 = 15
So, the range of this data set is 15.
How to Find the Range in Math
If you’re wondering how to calculate range in math, follow these simple steps:
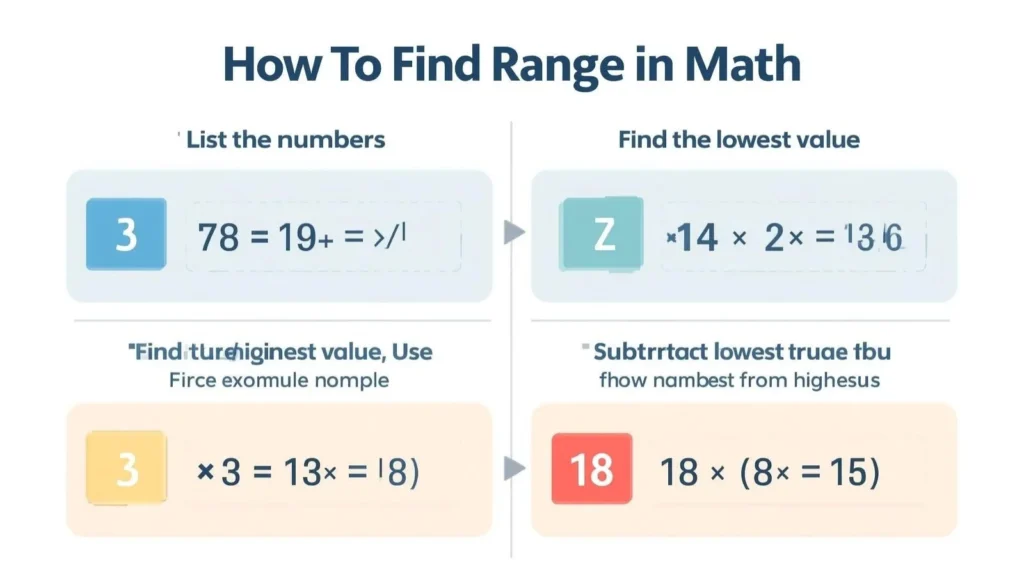
Step 1: List the Numbers
Start with the numbers given in the problem.
Example:
3, 7, 9, 14, 18
Step 2: Identify the Highest Value
Look for the largest number in the data set.
Highest value = 18
Step 3: Identify the Lowest Value
Find the smallest number.
Lowest value = 3
Step 4: Subtract the Lowest from the Highest
Range = 18 − 3 = 15
So, the range of the numbers is 15.
This method works for any set of numbers or data set in math.
Example of Range in Math
Let’s look at a few more range examples to make the concept clearer.
Example 1
Numbers: 4, 10, 15, 20
Highest value = 20
Lowest value = 4
Range = 20 − 4 = 16
Example 2
Numbers: 12, 16, 19, 25, 30
Highest value = 30
Lowest value = 12
Range = 30 − 12 = 18
Example 3
Test scores: 65, 70, 75, 80, 90
Highest score = 90
Lowest score = 65
Range = 90 − 65 = 25
These examples show how range helps measure the spread of values in different situations.
Range in Statistics
In statistics, range is used to describe how much the values in a data set vary. It provides a quick way to understand the spread of the data.
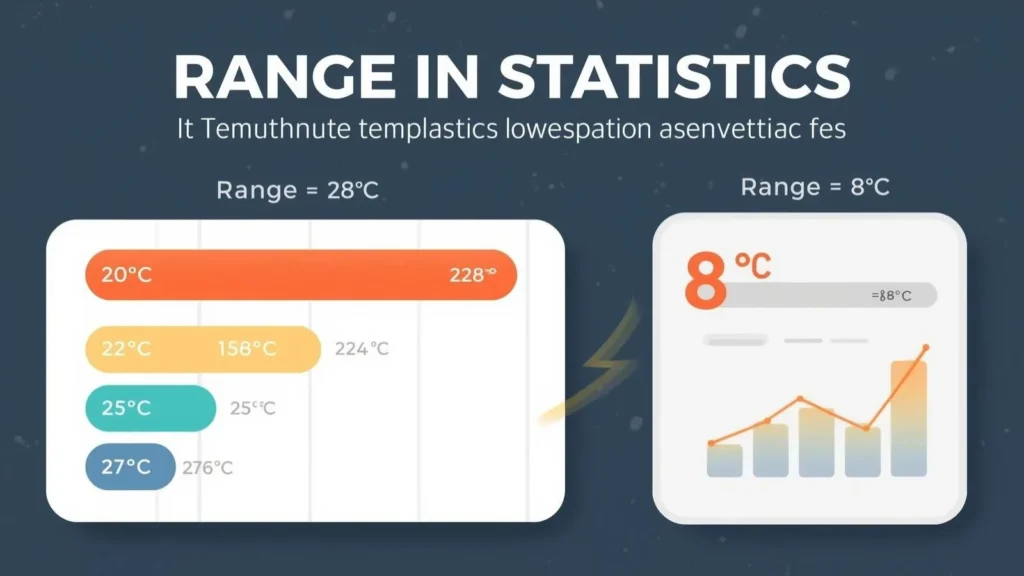
For example:
Daily temperatures for a week:
20°C, 22°C, 25°C, 27°C, 28°C
Highest temperature = 28°C
Lowest temperature = 20°C
Range = 8°C
This tells us that the temperatures varied within an 8-degree range during the week.
Although range is useful, statisticians often combine it with other measures of dispersion, such as:
- Mean
- Median
- Standard deviation
These measures give a more detailed understanding of data.
Difference Between Range and Mean
Students sometimes confuse range with mean, but they measure different things.
| Concept | Meaning | Example |
| Range | Difference between highest and lowest values | 20 − 5 = 15 |
| Mean | Average of numbers | (5+10+15+20) ÷ 4 |
Key Difference
- Range shows how spread out the numbers are.
- Mean shows the average value.
Both are important when studying statistics and data analysis.
Range vs Domain and Range in Functions
In algebra, the word range can also appear when discussing functions.
In this context:
- Domain = all possible input values (x-values)
- Range = all possible output values (y-values)
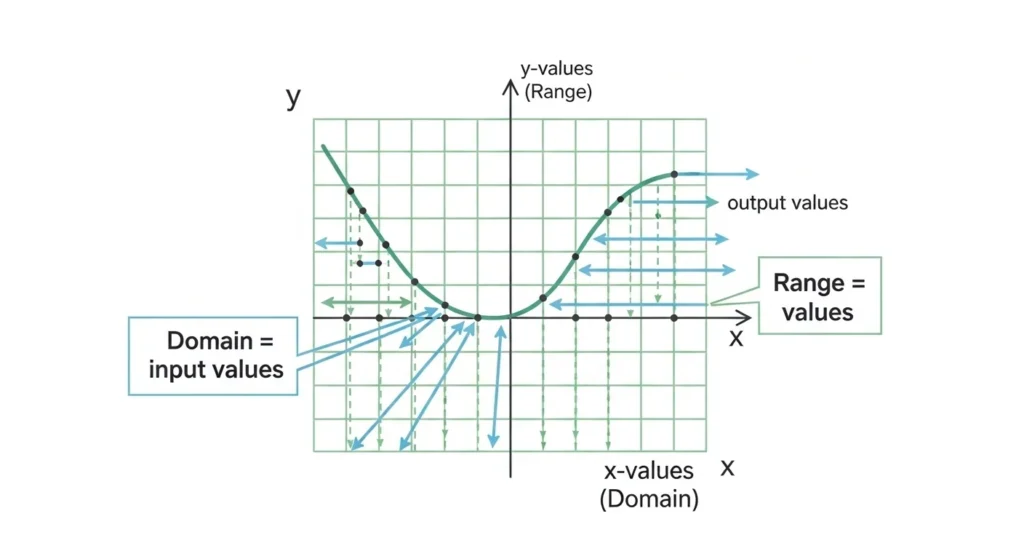
Example:
If a function produces outputs 2, 4, 6, 8, then the range of the function is:
{2, 4, 6, 8}
This meaning of range is slightly different from the data set range, but both describe sets of values.
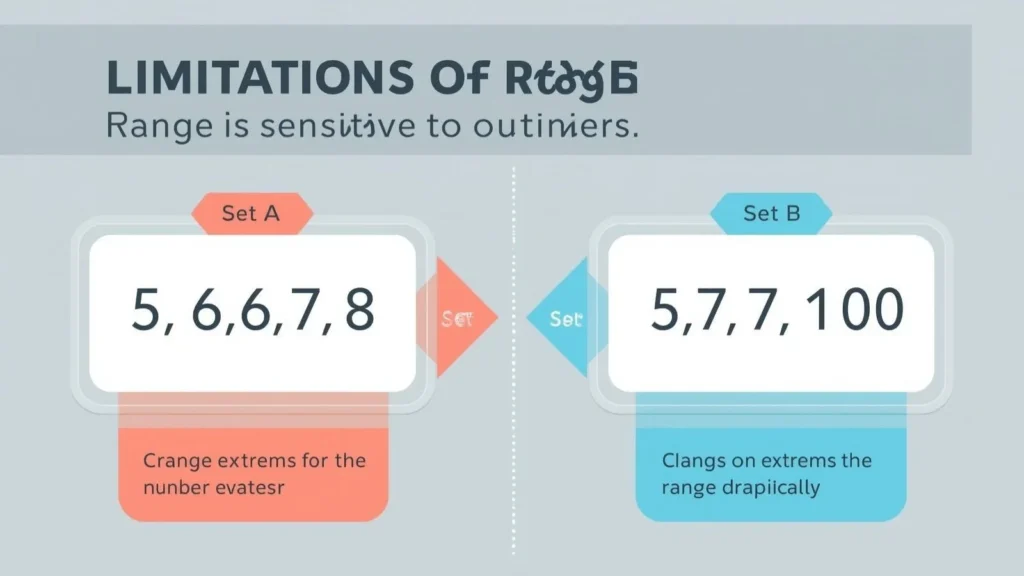
Limitations of Range
Although the range of a data set is useful, it has some limitations.
1. Sensitive to Extreme Values
If one number is extremely large or small, the range can become misleading.
Example:
5, 6, 7, 8, 100
Range = 100 − 5 = 95
Most numbers are close together, but the range appears very large because of one value.
2. Does Not Show Distribution
Range only tells us the difference between two numbers, not how the rest of the data is spread.
Because of this, statisticians often use standard deviation or interquartile range for deeper analysis.
Practice Problems
Try solving these range problems yourself.
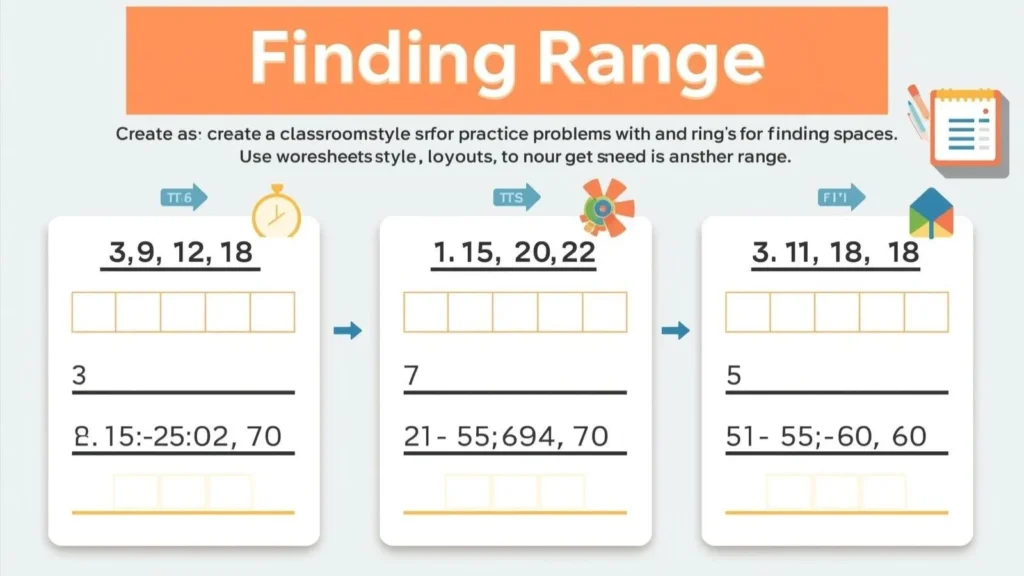
Problem 1
Numbers: 3, 9, 12, 18
Highest value = 18
Lowest value = 3
Range = 15
Problem 2
Numbers: 7, 11, 15, 20, 22
Range = 22 − 7 = 15
Problem 3
Numbers: 50, 55, 60, 70
Range = 70 − 50 = 20
Practicing these examples will help you master how to find the range in math.
FAQs About Range in Math
What does range mean in math?
The range in math is the difference between the highest value and the lowest value in a set of numbers.
What is the range formula?
The range formula is:
Range = Maximum value − Minimum value
How do you find the range of a data set?
To find the range of a data set:
- Identify the largest number
- Identify the smallest number
- Subtract the smallest from the largest
Can the range be zero?
Yes. If all numbers in the data set are the same, the range will be zero.
Example:
8, 8, 8, 8 → Range = 0
Why is range important in statistics?
Range helps quickly measure how spread out the numbers are in a data set.
Conclusion: What Does Range Mean in Math?
Understanding what range means in math is an important step in learning statistics and data analysis. The range definition in math simply refers to the difference between the highest value and the lowest value in a data set.
By using the range formula (maximum value minus minimum value), you can easily measure how spread out numbers are.
Whether you’re analyzing test scores, temperatures, measurements, or any set of numbers, knowing how to calculate range in math helps you quickly understand the variability in data.
Although it’s one of the simplest measures of dispersion in statistics, it provides valuable insight into the spread of numbers and forms the foundation for deeper statistical analysis.

Jackson Madison is a forward-thinking creator with a drive for innovation and meaningful impact. His vision blends creativity, strategy, and authenticity to inspire growth and change.
Leave a Comment